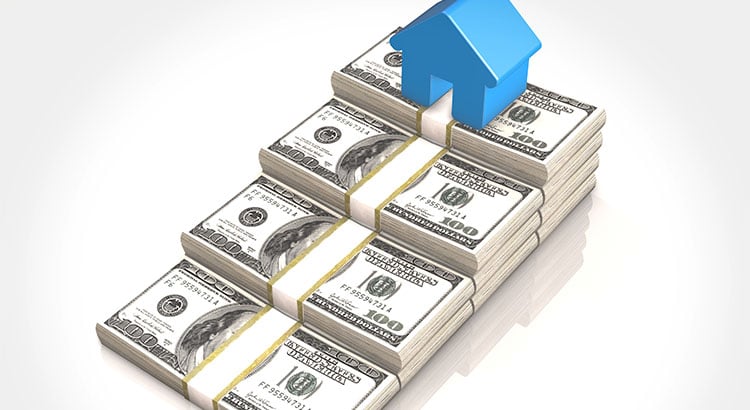
Home Prices Up 6.15% Across the Country! [INFOGRAPHIC]
Some Highlights:
- The Federal Housing Finance Agency (FHFA) recently released their latest Quarterly Home Price Index report.
- In the report, home prices are compared both regionally and by state.
- Based on the latest numbers, if you plan on relocating to another state, waiting to move may end up costing you more!
- Alaska, Delaware, West Virginia & Wyoming were the only one states where home prices are lower than they were last year.
Home Prices Up 6.15% Across the Country! [INFOGRAPHIC] Read More »


 The success of the housing market is strongly tied to the consumer’s confidence in the overall economy. For that reason, we believe 2017 will be a great year for real estate. Here is just a touch of the news coverage on the subject.
 If your house no longer fits your needs and you are planning on buying a luxury home, now is a great time to do so! We recently shared
 Self-made millionaire David Bach was quoted in a CNBC
 There are some people who have not purchased homes because they are uncomfortable taking on the obligation of a mortgage. Everyone should realize that, unless you are living with your parents rent-free, you are paying a mortgage – either yours or your landlord’s.

 CoreLogic recently released a report entitled,
 Mortgage interest rates have risen over the last few months and projections are that they will continue their upswing throughout 2017. What impact will this have on the housing market? Here is what the experts are saying:
 A study by Edelman Berland reveals that 33% of homeowners who are contemplating selling their houses in the near future are planning to scale down. Let’s look at a few reasons why this might make sense for many homeowners, as the majority of the country is currently experiencing a
 Here are four great reasons to consider buying a home today instead of waiting.

 Home values have risen dramatically over the last twelve months. The latest