



Housing Market Updates
How Low Supply & High Demand Impacts the Real Estate Market [INFOGRAPHIC]

Some Highlights:
- The concept of Supply & Demand is a simple one. The best time to sell something is when the supply of that item is low & the demand for that item is high!
- Anything under a 6-month supply is a Seller’s Market!
- There has not been a 6-months inventory supply since August 2012!
- Buyer Demand continues to outpace Seller Supply!
The Foreclosure Crisis: 10 Years Later

 CoreLogic recently released a report entitled, United States Residential Foreclosure Crisis: 10 Years Later, in which they examined the years leading up to the crisis all the way through to present day.
What Are the Experts Saying about Mortgage Rates?

 Mortgage interest rates have risen over the last few months and projections are that they will continue their upswing throughout 2017. What impact will this have on the housing market? Here is what the experts are saying:
Which Homes Have Appreciated the Most?

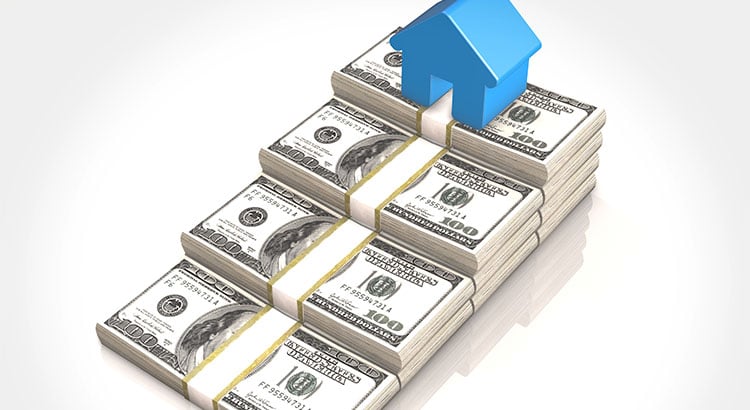 Home values have risen dramatically over the last twelve months. The latest Existing Home Sales Report from the National Association of Realtors puts the annual increase in the median existing-home price at 7.1%. CoreLogic, in their most recent Home Price Insights Report, reveals that national home prices have increased by 6.9% year-over-year.
A Tale of Two Markets: Inventory Mismatch Paints a More Detailed Picture

 The inventory of existing homes for sale in today’s market was recently reported to be at a 3.6-month supply according to the National Association of Realtors latest Existing Home Sales Report. Inventory is now 7.1% lower than this time last year, marking the 20th consecutive month of year-over-year drops.
Spring Forward: The Difference An Hour Makes [INFOGRAPHIC]

Some Highlights:
- Don’t forget to set your clocks forward this Sunday, March 12th at 2:00 AM EST in observance of Daylight Savings Time.
- Unless of course, you are a resident of Arizona or Hawaii!
- Every hour in the United States: 649 homes are sold, 177 homes regain equity (meaning they are no longer underwater on their mortgage), and the median home price rises $1.86!
Thinking of Selling? Do it TODAY!!

 That headline might be a little aggressive. However, as the data on the 2017 housing market begins to roll in, we can definitely say one thing: If you are considering selling, IT IS TIME TO LIST YOUR HOME!
How Long Do Most Families Stay in Their Home?

 The National Association of Realtors (NAR) keeps historical data on many aspects of homeownership. One of the data points that has changed dramatically is the median tenure of a family in a home. As the graph below shows, for over twenty years (1985-2008), the median tenure averaged exactly six years. However, since 2008, that average is almost nine years – an increase of almost 50%.
Existing Home Sales Reach Highest Mark Since 2007 [INFOGRAPHIC]

Highlights:
- Sales of existing homes reached the highest pace in a decade at a seasonally adjusted annual rate of 5.69 million.
- January marked the 59th consecutive month of year-over-year price gains as the median home price rose 7.1% to $228,900.
- NAR’s Chief Economist, Lawrence Yun had this to say, ‘Much of the country saw robust sales activity last month as strong hiring and improved consumer confidence at the end of last year appear to have sparked considerable interest in buying a home.’
Buyers Are Searching For Your House

 The most recent Pending Homes Sales Index from the National Association of Realtors revealed a slight bump in contracts with an increase of 1.6% in December. This news comes as existing home sales are also forecasted to be on pace for 5.54 million in 2017, a 1.7% increase over 2016, which was the best year for sales in a decade.
Lack of Homes for Sale Slowing Down the Housing Market

 The housing crisis is finally in the rear-view mirror as the real estate market moves down the road to a complete recovery. Home values are up. Home sales are up. Distressed sales (foreclosures and short sales) have fallen dramatically. It seems that 2017 will be the year that the housing market races forward again.
Buyer Demand Is Outpacing the Supply of Homes for Sale

 The price of any item is determined by the supply of that item, as well as the market demand. The National Association of REALTORS (NAR) surveys “over 50,000 real estate practitioners about their expectations for home sales, prices and market conditions” for their monthly REALTORS Confidence Index.